


Using Grafana with your Loadbalancer.org appliance
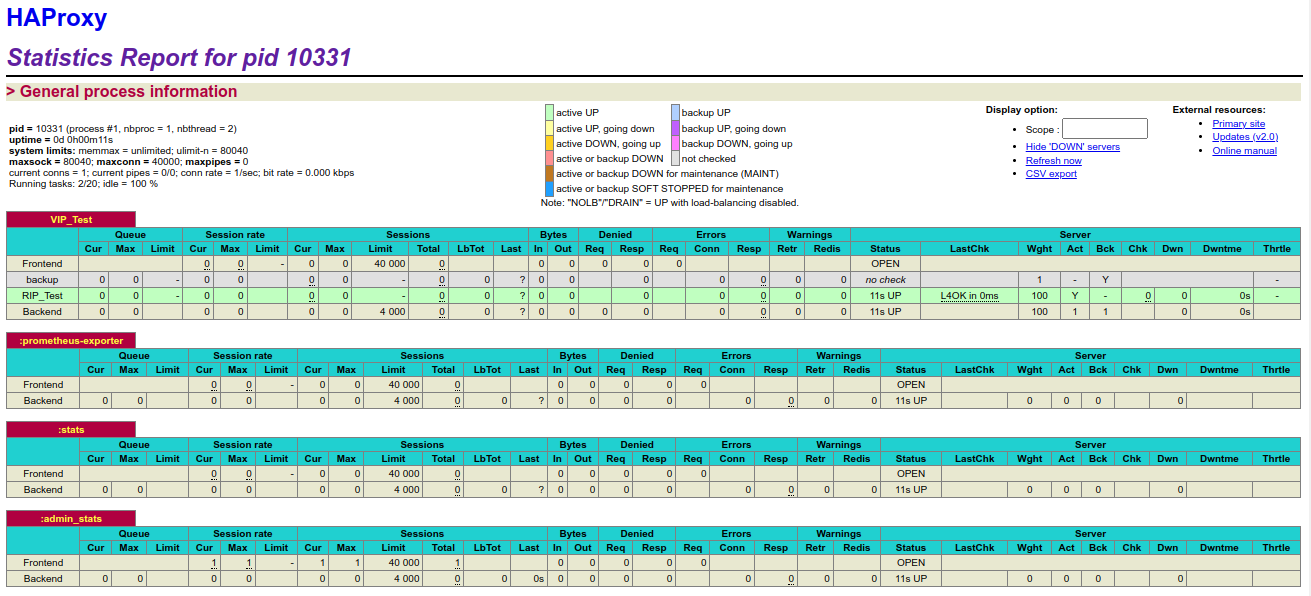
How many times have you looked at the HAProxy report and thought, what on earth is this all about?! What are the busiest times on my Loadbalancer? Which Real Server is busy? How much traffic is going through my VIPs?

In our previous blog, we took you through, step-by-step, how to activate and configure the Prometheus exporter for your Loadbalancer.org appliance. The Prometheus server provides basic graphing tools, but it is nothing compared to the monitoring and dashboard features that the Grafana system provides!
Here we'll take you through the configuration and setup of a Grafana dashboard for your Loadbalancer.org appliance.
Why you need a dashboard...
How many times have you looked at the HAProxy report and thought, what on earth is this all about?! What are the busiest times on my Loadbalancer? Which Real Server is busy? How much traffic is going through my VIPs? How can I see a history of my Loadbalancer performance?
There's a simple answer to all of these questions — use Grafana.
What is Grafana?
Grafana is a tool that allows you to visualise data from multiple data sources, like Prometheus or the many other variants of Time Series Databases (TSDB) that are supported. You can create charts and graphs, which can be presented in a single dashboard, or across many dashboards. Grafana gives you the ability to present the collected data and overly-complicated reports (like the one above) in a simplified and interactive dashboard. In fact, there's no limit to the number of dashboards you can create!
Installing Grafana
The full installation guide for Grafana is outside the scope of this article, however check out this how-to guide on the Grafana website for full details.
Launching Grafana
How you access your instance of Grafana, will depend on how you've installed it. In this example, we will assume it is installed on a server, residing at 192.168.83.0 with the default port set to 3000.
To open the web UI for Grafana, simply point your web browser to http://192.168.83.0:3000/login (as per the example above).
This should present you with the following Grafana login screen:
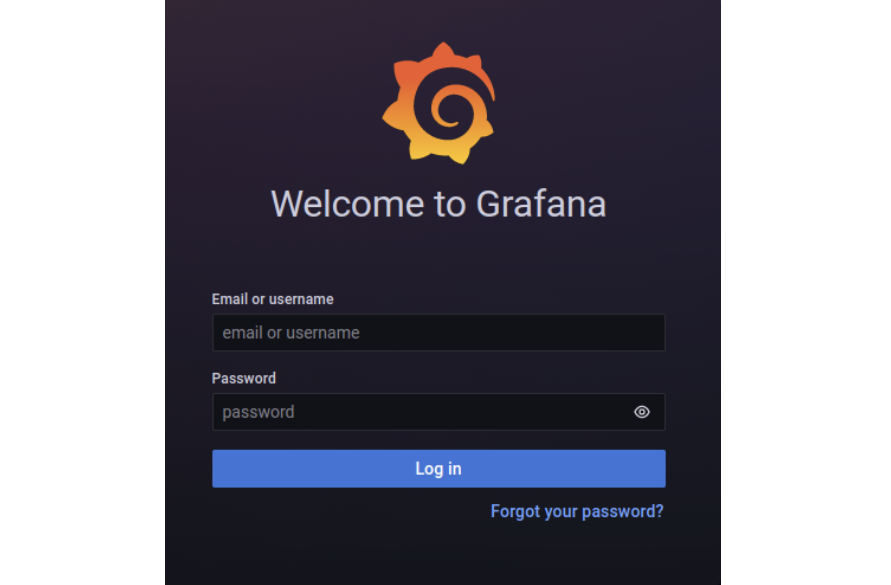
The default login credentials for a fresh installation of Grafana is admin/admin (you can change this through the profile / change password page).
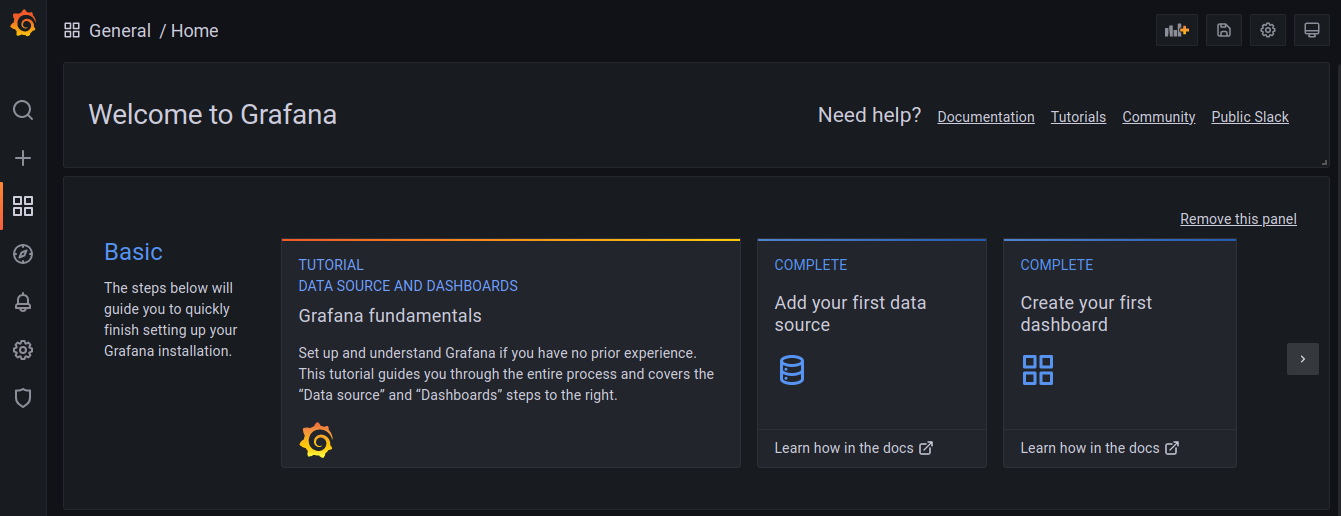
After a successful login, you should be greeted by the "Welcome to Grafana" home page:
Setting up the Prometheus data source
After you have a working installation of Grafana, the first thing you will need to do is to identify a data source.
In our previous blog on using Prometheus, we talked about how to setup a Prometheus server. As a continuation, we shall assume you have a Prometheus server already up and running, so we'll just need to add this as a new data source to our Grafana installation:

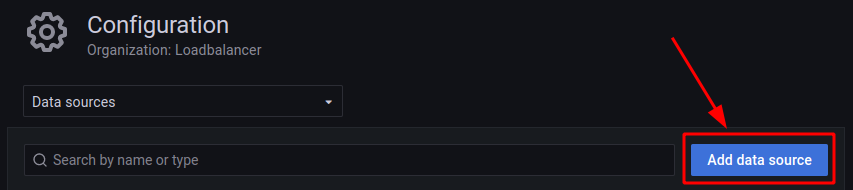
Click on the Cog icon, which is the Configuration menu. From here, click on Data sources which will take you to the Data sources page. After that you can then click on the Add data source button:
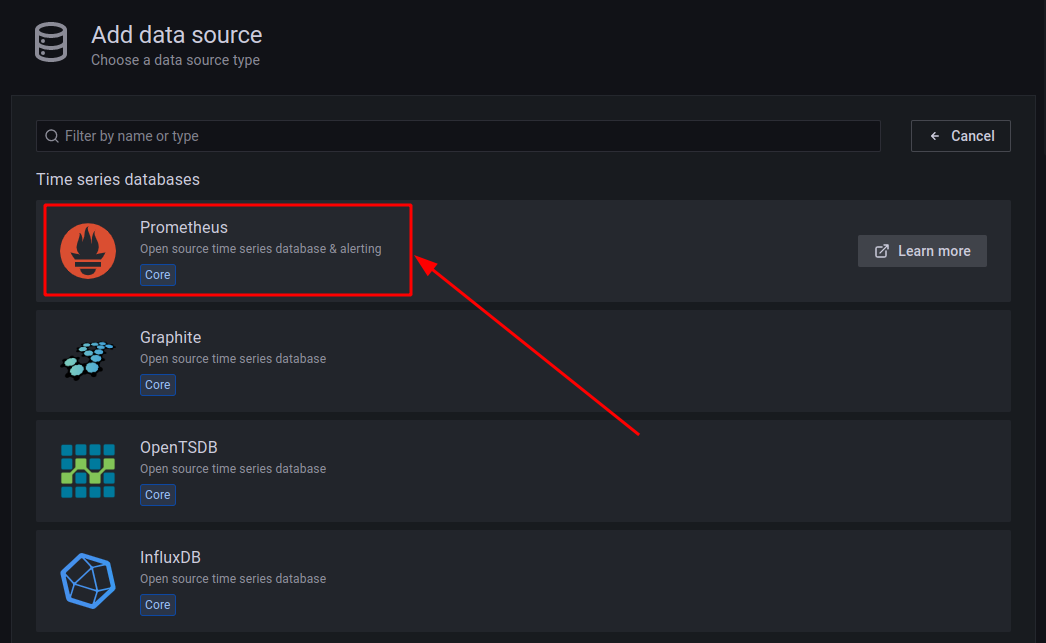
Here, we'll be presented with a list of supported data sources. Click on Prometheus:
You can name your data source anything you wish — in our example, we'll set the Name to "Prometheus" . You can also have many data sources of the same type.
Our data source here is our Prometheus server's IP address. In this case that is 192.168.83.0 on port 9090 :
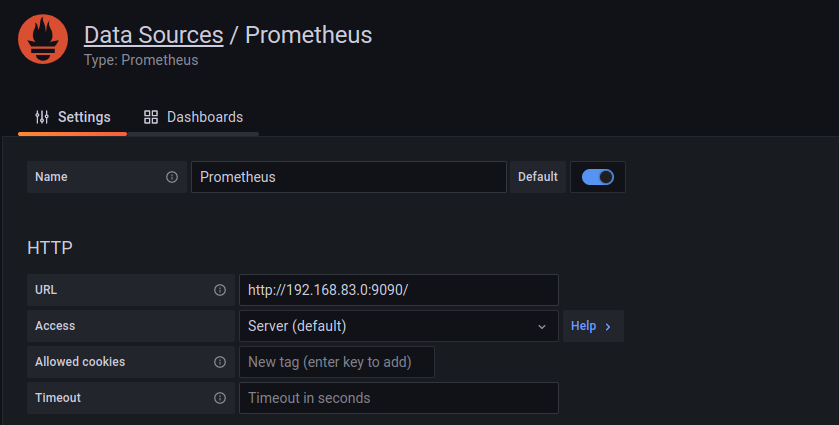
For the URL we can use http://192.168.83.0:9090/. The rest of the fields can be left as default:
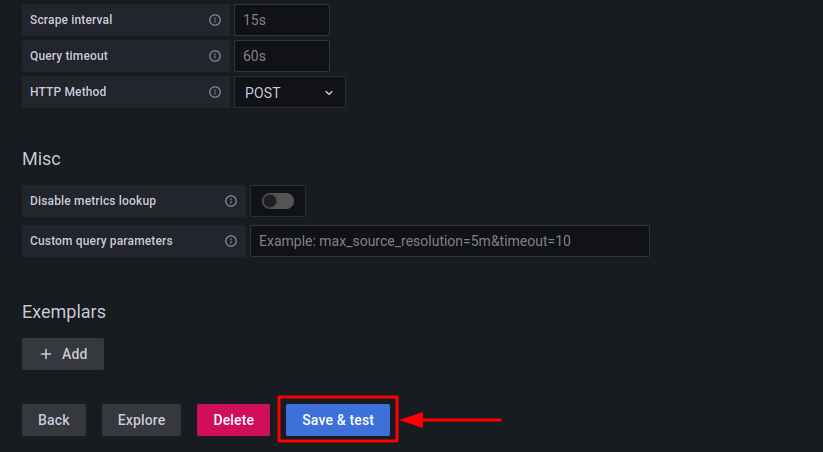
After this, click on Save & test to save this data source and test the connection.
All being well, you should then see a confirmation that the new data source is working:

Now we're ready to move onto the exciting stuff ...!
Importing Dashboards from the Grafana website
Creating new dashboards in Grafana is relatively easy and straight forward. The dashboard builder is very intuitive and there are plenty of tutorials on-line to get you up and running in no time. However, there is a quicker way to get a fully working dashboard, especially for more complex data sources, such as HAProxy.
The Grafana Dashboard Library
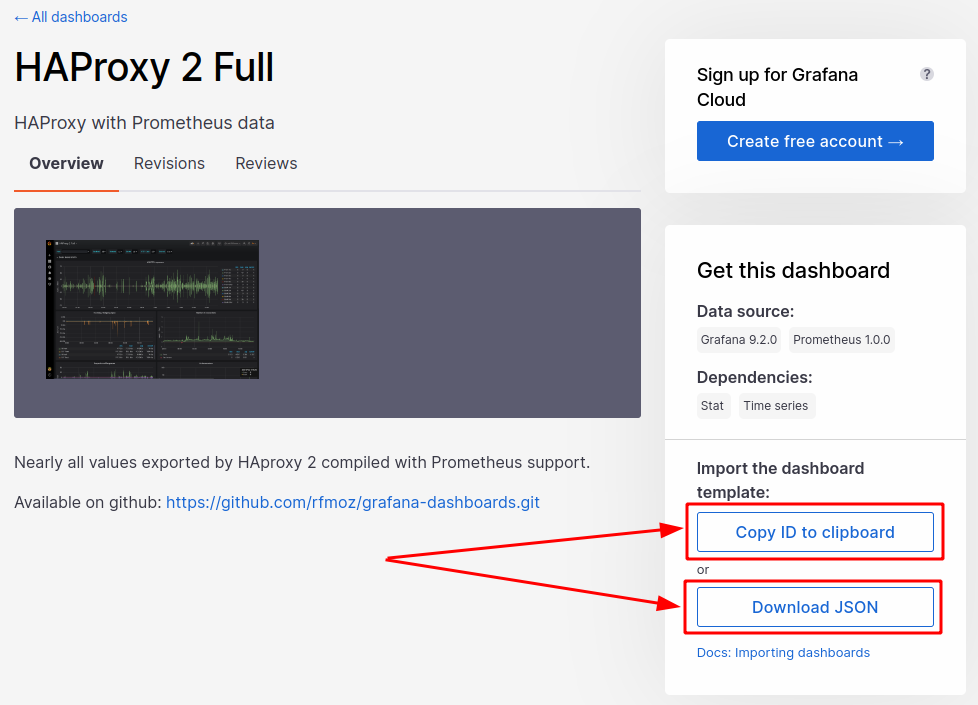
The Grafana website provides a fantastic library with a vast array of dashboards for all kinds of data sources and applications. In this instance though we are only really interested in the HAProxy 2 Full Dashboard.
Here you can either Copy the dashboard ID to your clipboard or Download the JSON file:
The Grafana tool provides a great feature whereby you can import dashboards, either via a dashboard ID from the Grafana website, or via a JSON formatted file.
Importing a Dashboard
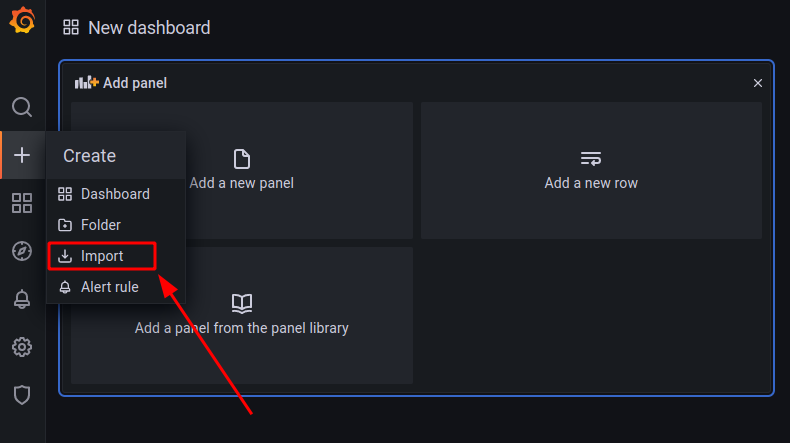
To import a dashboard from an external source such as the Grafana website, click on the + icon for the Create menu, and select Import:
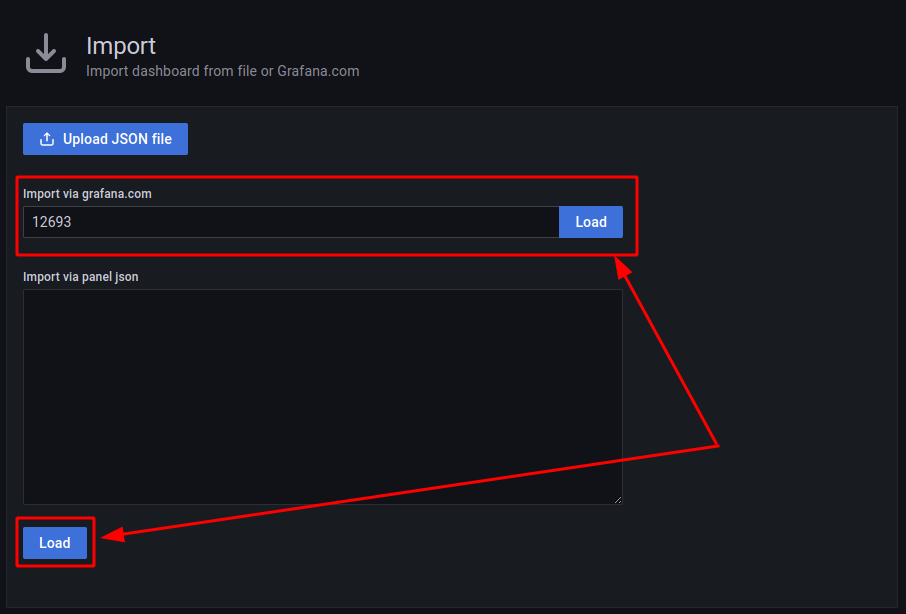
Once on the Import page, there are several options available as to which method to use in order to import a dashboard. The simplest way to import from the Grafana website is via copying the dashboard ID (as referenced above), and then just paste it into the Import via grafana.com field (in this case the ID is 12693). Then all you have to do is click the Load button:
All being well, the Import page will then prompt you for a Name and the Prometheus data source. Give the dashboard a name and ensure the Prometheus data source is set to the example we've already defined. In this case we will select "Prometheus":
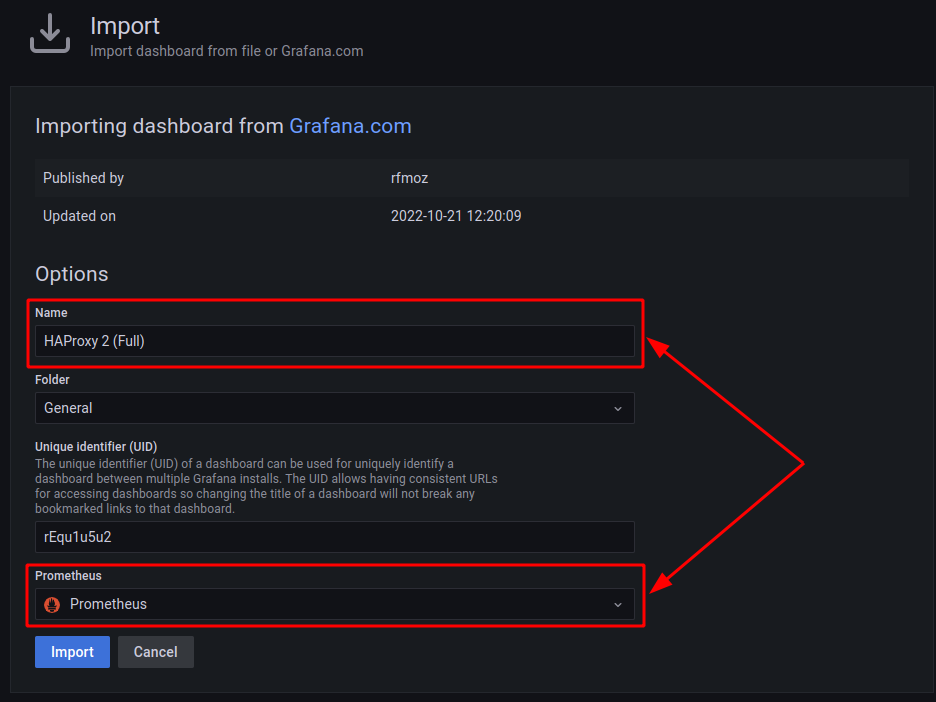
Then click on the Import button.
The Dashboard
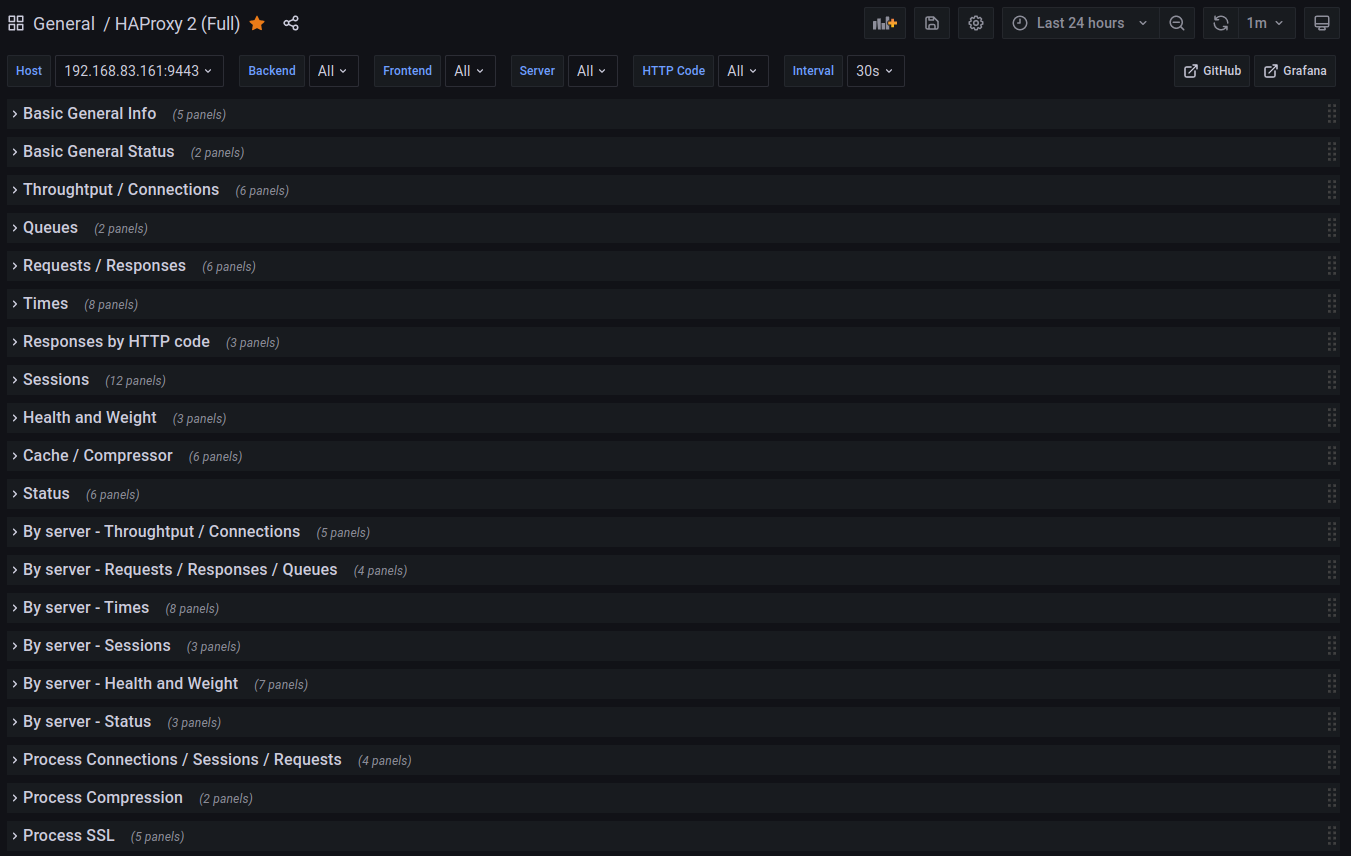
Finally, you should now be able to see the newly created dashboard: HAProxy 2 (Full).
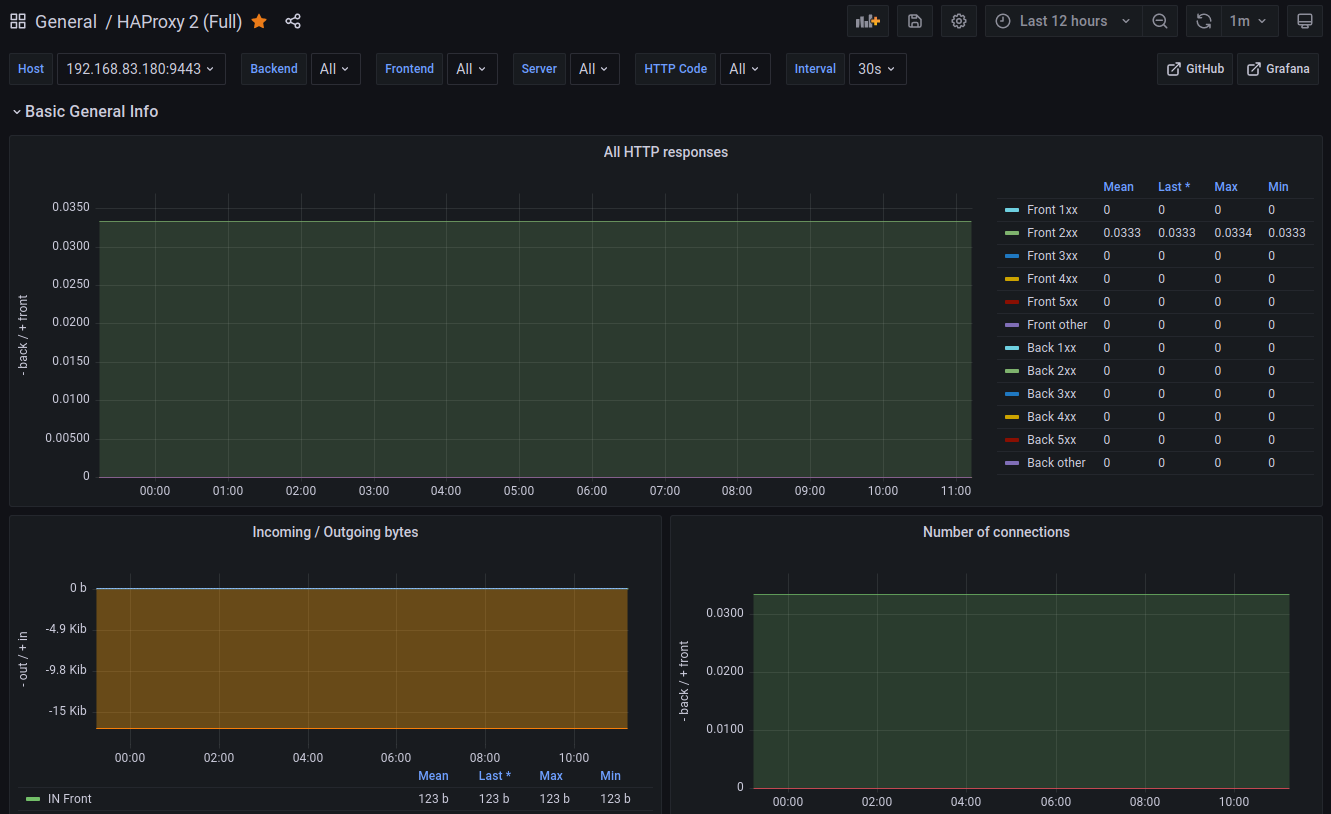
There are a large number of interactive graphs available here, all categorized based on their data types. Go ahead and explore — there is a wealth of information here, all represented in a much clearer and more meaningful way:
Conclusion
Hopefully you've seen here the potential benefits of exporting your Loadbalancer's HAProxy reporting data into tools such as Prometheus and Grafana! Coming up next will be our next and final blog in this series, exploring the power of using the Grafana Alert Manager for triggering alerts based on user-defined rules.
Watch this space!

Why is public cloud potentially a bad idea from a programmer's perspective?


Load balancing Moodle's learning application system (LMS)

Related posts
Unlocking the power of Endurance: A beginner's API guide for smarter load balancing

Building Endurance: A load balancer with a clear purpose

No one wants a backup — what they really need is guaranteed recovery
10 things to try during your ADC Portal free trial: Centralized management made easy
How can I load balance UDP with open source HAProxy?

HAProxy Enterprise Edition vs Progress Kemp LoadMaster: A no-fluff engineer comparison
Loadbalancer.org announces leadership transition and next phase of growth
ENVOY Proxy versus Loadbalancer.org: Why storage vendors need purpose-built load balancing for S3, NFS, and SMB