


In today's security-conscious world, logs are crucial for gaining insight into your systems. But why limit your log storage to the device that creates them?
Centralized log aggregation allows you to collect logs from multiple sources in a single location, providing a more comprehensive view of your traffic and improving security analysis. This can be particularly beneficial for load-balanced environments, where traffic is distributed across several servers, as it helps you get a complete picture of your network activity and identify potential issues more efficiently.
Table of contents
- Why use Grafana Loki
- The Grafana, Loki and Alloy stack
- How to install Grafana
- How to install Loki
- How to install Alloy
- How to install and configure Rsyslog
- How to connect the Grafana front end to Loki
- How to do all this with a Loadbalancer appliance
- HAProxy log structure
Why use Grafana Loki?
Aggregated logging or centralized logging, is a critical practice for modern IT environments with the core use being to collect, normalize, and centralize log data from every application, server, and network device into a single, searchable platform. This single source of truth provides immense value for various teams and a wide range of operational needs.
The goods news is that we can implement a cost-effective and scalable logging solution using Loki and Grafana, which centralizes logs from all your services into a single platform, drastically reducing the time your teams spend on troubleshooting and debugging.
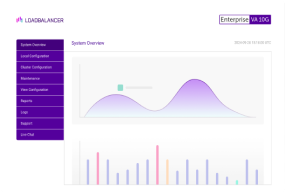
By using Grafana to visualize this log data, you gain real-time insights into your system's health, helping you proactively identify and fix issues before they impact your customers. In short, this technology stack will improve your operational efficiency, reduce downtime, and save money on traditional logging solutions.
Paired with our other blogs on Prometheus and displaying metrics with Grafana this information will give you a complete picture of the traffic flowing through your Loadbalancer.org appliance.
What is Granfana Loki?
Garafana Loki is a log aggregation system designed to be scalable, highly available and cost effective. It focuses on indexing metadata about log streams rather than the full body content of the logs, making it simpler and cheaper to run when compared to other logging systems. Grafana dashboards and be paired with Loki to visualise your logs and make searching them easier.
It's also worth mentioned Grafana Alloy at this point, as they work so well together.
What is Grafana Alloy?
Grafana Alloy is an open-source vendor neutral distribution of the OpenTelemetry Collector which is designed for collecting and processing metrics, logs, traces and profiles. Grafana Alloy can be deployed anywhere in your IT infrastructure.
The Grafana, Loki and Alloy stack
The Grafana, Loki and Alloy stack can be installed in many different ways, like bare metal, in VM’s, in docker containers, on Kubernetes or in the cloud.
For this tutorial we will be installing on nodes running Ubuntu 24.04 LTS with the bare minimum needed to test the functionality, but for production you should look at Grafana’s sizing guides mainly around Loki as it will be storing the data from HAProxy and the system hosting it, Grafana's sizing guide can be found here.
Bare metal lab configuration
Here are the components needed for a bare metal configuration:
| Component | vCPU | vRAM | Storage |
|---|---|---|---|
| Grafana | 2 | 2GB | 50GB |
| Loki | 2 | 2GB | 150GB (adjust as per Grafana's size guide) |
| Alloy | 2 | 2GB | 50GB |
After deploying your Ubuntu 24.04 LTS machines make sure that they are up to date.
Make sure all your other systems are up to date too:
sudo apt update && sudo apt upgrade -y How to install Grafana
On the system that's going to be the Grafana front end the following steps need to be taken:
- Install the needed dependences:
sudo apt install -y apt-transport-https software-properties-common wget curl gpg- Add the Grafana APT Repository
sudo mkdir -p /etc/apt/keyrings/

wget -q -O - https://apt.grafana.com/gpg.key | gpg --dearmor | sudo tee /etc/apt/keyrings/grafana.gpg > /dev/null

echo "deb [signed-by=/etc/apt/keyrings/grafana.gpg] https://apt.grafana.com stable main" | sudo tee -a /etc/apt/sources.list.d/grafana.list

sudo apt update- Install Grafana:
sudo apt install grafana -y- Start, Enable and check the status of the Grafana Server:
sudo systemctl start grafana-server
sudo systemctl enable grafana-server
sudo systemctl status grafana-server
You should see output indicating that the service is active (running).
- Access the Grafana WebUI
At this point you should have a running Grafana server, Grafana runs on port 3000.
Open a web browser and navigate to:
http://your_server_ip_or_domain:3000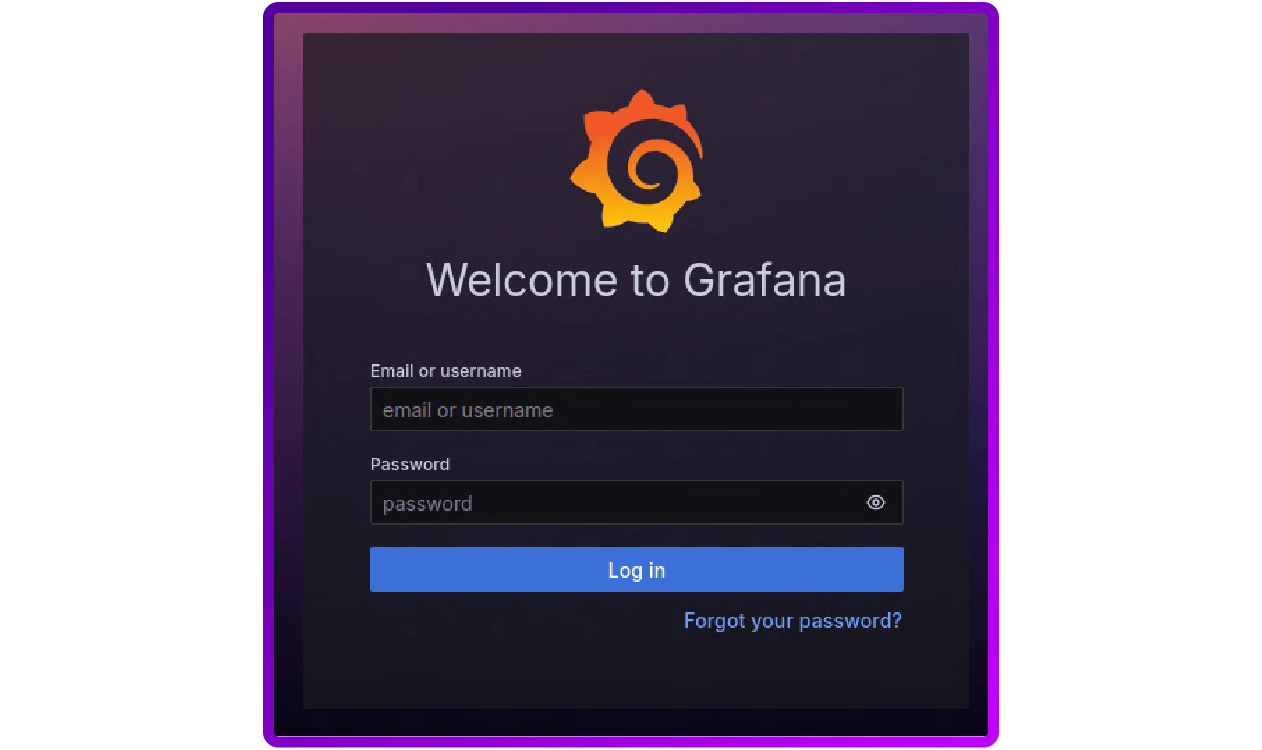
The default login is: admin \ admin
You’ll be prompted to change the default password upon your first login.
How to install Loki
On the system that is going to be the Loki server, the following will be needed:
- Install the needed dependences:
sudo apt install -y wget unzip2. Find the latest version of Loki:
LOKI_VERSION=$(curl -s "https://api.github.com/repos/grafana/loki/releases/latest" | grep -Po '"tag_name": "v\K[0-9.]+')
echo "Latest Loki version: v${LOKI_VERSION}"
3. Download the Loki Binary:
wget "https://github.com/grafana/loki/releases/download/v${LOKI_VERSION}/loki-linux-amd64.zip"4. Unzip and move Loki:
unzip loki-linux-amd64.zip
sudo mv loki-linux-amd64 /usr/local/bin/loki
sudo chmod +x /usr/local/bin/loki
5. Verify Loki is installed:
loki --version6. Create a folder to hold the Loki configuration:
sudo mkdir -p /etc/loki7. Download the base configuration for Loki:
sudo wget -qO /etc/loki/config.yaml "https://raw.githubusercontent.com/grafana/loki/v${LOKI_VERSION}/cmd/loki/loki-local-config.yaml"8. If needed you can make configuration changes to Loki, the available configuration options can be found here:
sudo nano /etc/loki/config.yaml9. Create a Systemd service for Loki:
sudo nano /etc/systemd/system/loki.service[Unit]
Description=Loki log aggregation system
After=network.target
[Service]
Type=simple
User=loki # Create this user if it doesn't exist
ExecStart=/usr/local/bin/loki -config.file /etc/loki/config.yaml
Restart=on-failure
RestartSec=10
StandardOutput=journal
StandardError=journal
[Install]
WantedBy=multi-user.target10. Create the Loki Daemon user account:
sudo useradd --system --no-create-home --shell /bin/false loki11. Make sure that the new user can read the Loki config:
sudo chown -R loki:loki /etc/loki # Ensure Loki user can read config12. Reload Systemd, start and enable Loki and check it's running:
sudo systemctl daemon-reload
sudo systemctl start loki
sudo systemctl enable loki
sudo systemctl status loki
You should see output indicating that the service is active (running).
13. Check Loki metrics endpoint:
curl http://your_server_ip_or_domain:3100/metricsHow to install Alloy
On the system that is going to be the Alloy, the following will be needed:
- Install the required dependences:
sudo apt install -y apt-transport-https software-properties-common wget curl gpg2. Add the Grafana APT Repository:
sudo mkdir -p /etc/apt/keyrings/

wget -q -O - https://apt.grafana.com/gpg.key | gpg --dearmor | sudo tee /etc/apt/keyrings/grafana.gpg > /dev/null

echo "deb [signed-by=/etc/apt/keyrings/grafana.gpg] https://apt.grafana.com stable main" | sudo tee -a /etc/apt/sources.list.d/grafana.list

sudo apt update
3. Install Grafana Alloy:
sudo apt install alloy -y4. Configure Alloy to be a Syslog server:
sudo nano /etc/alloy/config.alloyloki.source.syslog "syslog_tcp" {
listener {
address = "0.0.0.0:51893"
labels = { component = "loki.source.syslog", protocol = "tcp" }
}
relabel_rules = loki.relabel.syslog_01.rules
forward_to = [loki.write.default.receiver]
}
loki.source.syslog "syslog_udp" {
listener {
address = "0.0.0.0:51898"
protocol = "udp"
labels = { component = "loki.source.syslog", protocol = "udp" }
}
relabel_rules = loki.relabel.syslog_01.rules
forward_to = [loki.write.default.receiver]
}
loki.relabel "syslog_01" {
forward_to = []
rule {
action = "labelmap"
regex = "__syslog_(.+)"
}
}
loki.write "default" {
endpoint {
url = "http://<Loki_IP>:3100/loki/api/v1/push"
}
}
5. Modify Alloy service to expose the front end UI:
sudo vi /usr/lib/systemd/system/alloy.service6. Edit the ExecStart line:
Original
ExecStart=/usr/bin/alloy run $CUSTOM_ARGS --storage.path=/var/lib/alloy/data $CONFIG_FILENew
ExecStart=/usr/bin/alloy run $CUSTOM_ARGS --server.http.listen-addr=0.0.0.0:12345 --storage.path=/var/lib/alloy/data $CONFIG_FILE7. Reload Systemd, start and enable Alloy and check it is running:
sudo systemctl daemon-reload
sudo systemctl start alloy
sudo systemctl enable alloy
sudo systemctl status alloy
You should see output indicating that the service is active (running).
8. Check the WebUI:
On another system open a browser and navigate to:
http://your_server_ip_or_domain:12345This will show you a graphical representation of your Alloy configuration:
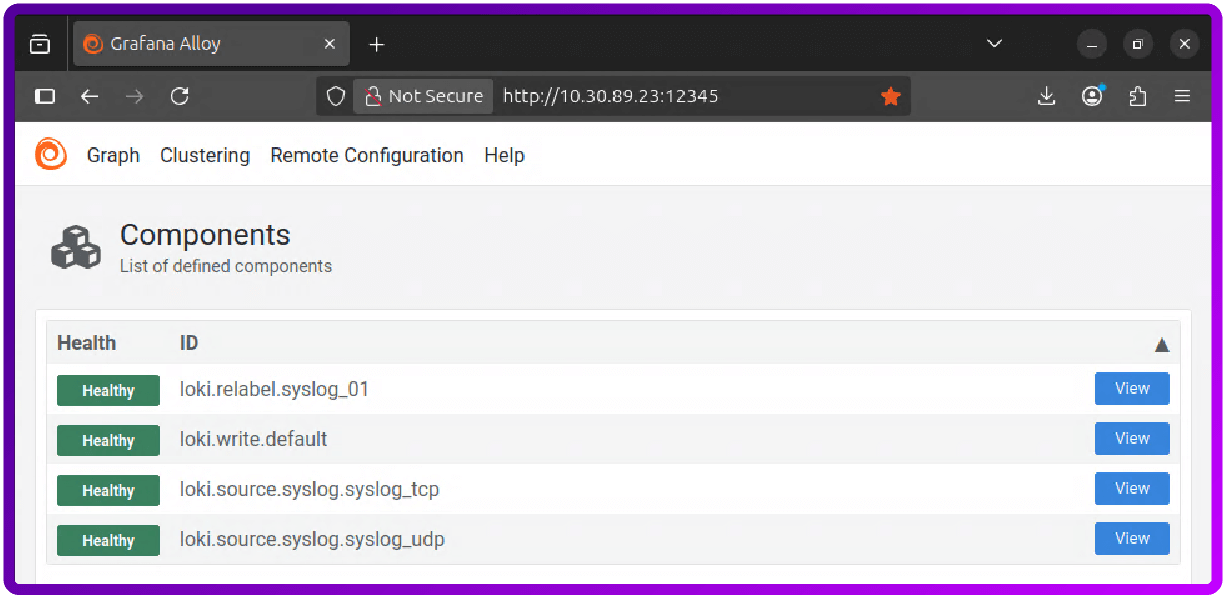
The install of Grafana, Loki and Alloy is now complete and we can move on to configuring HAProxy to send its access logs to Loki.
On the machine that's running HAProxy we need to make sure that Rsyslog service is installed and running and then configure it to send HAProxy access logs to Loki via Alloy.
How to install and configure Rsyslog
If you're looking to do this on a Loadbalancer.org appliance please see the section at the end of this blog ('How to do all this with a Loadbalancer appliance').
The Rsyslog install
- Make sure that your machine is up to date:
sudo apt update2. Install Rsyslog on to the system:
sudo apt install rsyslog3. Check Rsyslog has started:
sudo systemctl status rsyslogThe Rsyslog configuration
- Create a custom configuration file for Rsyslog to hold Alloy config - we will call it 30-alloy.conf so that it gets loaded before the default config for Rsyslog:
sudo nano /etc/rsyslog.d/30-alloy.conf2. Copy the following config into the new config file and save:
template(name="MyForwardFormat" type="string"
         string="<%PRI%>1 %TIMESTAMP:::date-rfc3339% %HOSTNAME% %APP-NAME% %PROCID% %MSGID% %STRUCTURED-DATA% %msg%\n")

# Send all messages to the Alloy endpoint
*.* @<alloy_server_IP>:51898;MyForwardFormat- <%PRI%>1 = The priority of the syslog message set by the sending application
- %TIMESTAMP:::date-rfc3339% = The time and date stamp formated to the RFC3339 standard
- %HOSTNAME% = The sending systems host name, in our case the load balancer
- %APP-NAME% = The application on the load balancer creating the entry
- %PROCID% = The Process ID of the sending application on the loadbalancer
- %MSGID% = The Message Identifier, a field within the message header that provides a specific, identifying tag for the type of message being logged.
- %STRUCTURED-DATA% = A message component that provides structured, interpretable, and decomposable data elements
- %msg%\n = Contains the actual content of the log message, including the event details
3. Restart Rsyslog to pick up the changes:
sudo systemctl restart rsyslog4. Check Rsyslog has started:
sudo systemctl status rsyslogHow to connect the Grafana front end to Loki
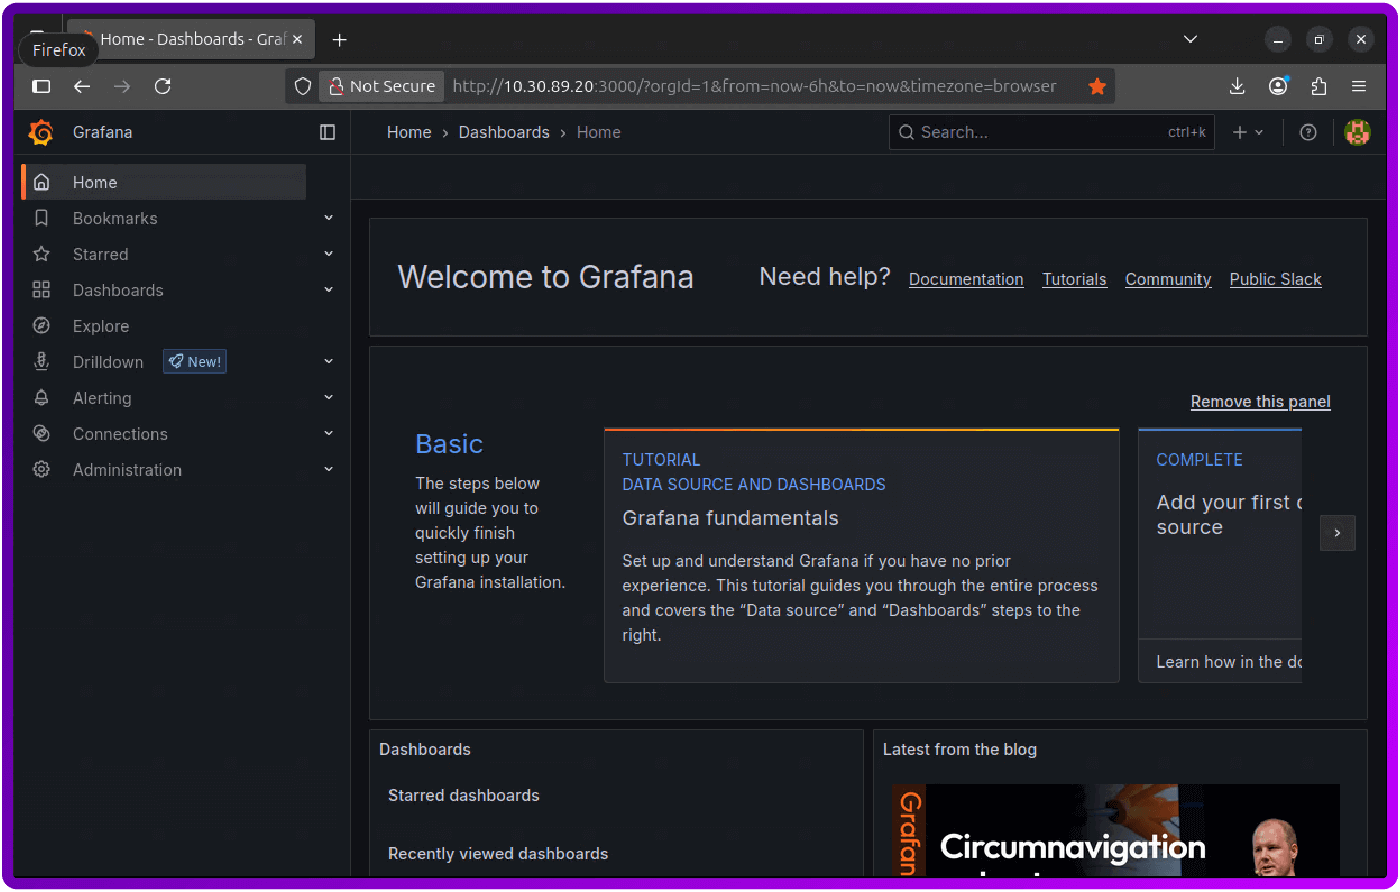
- Login to Grafana:
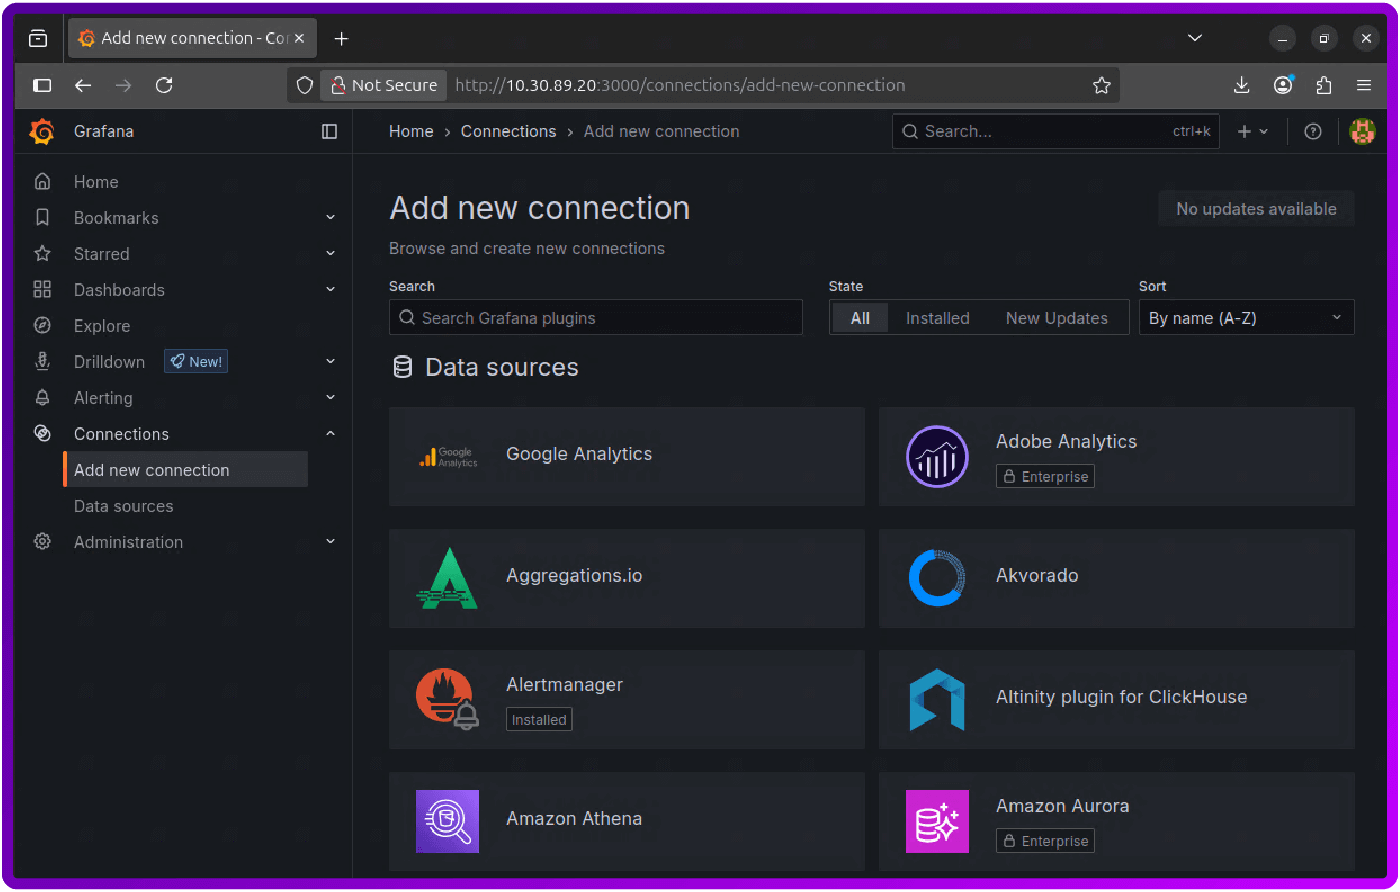
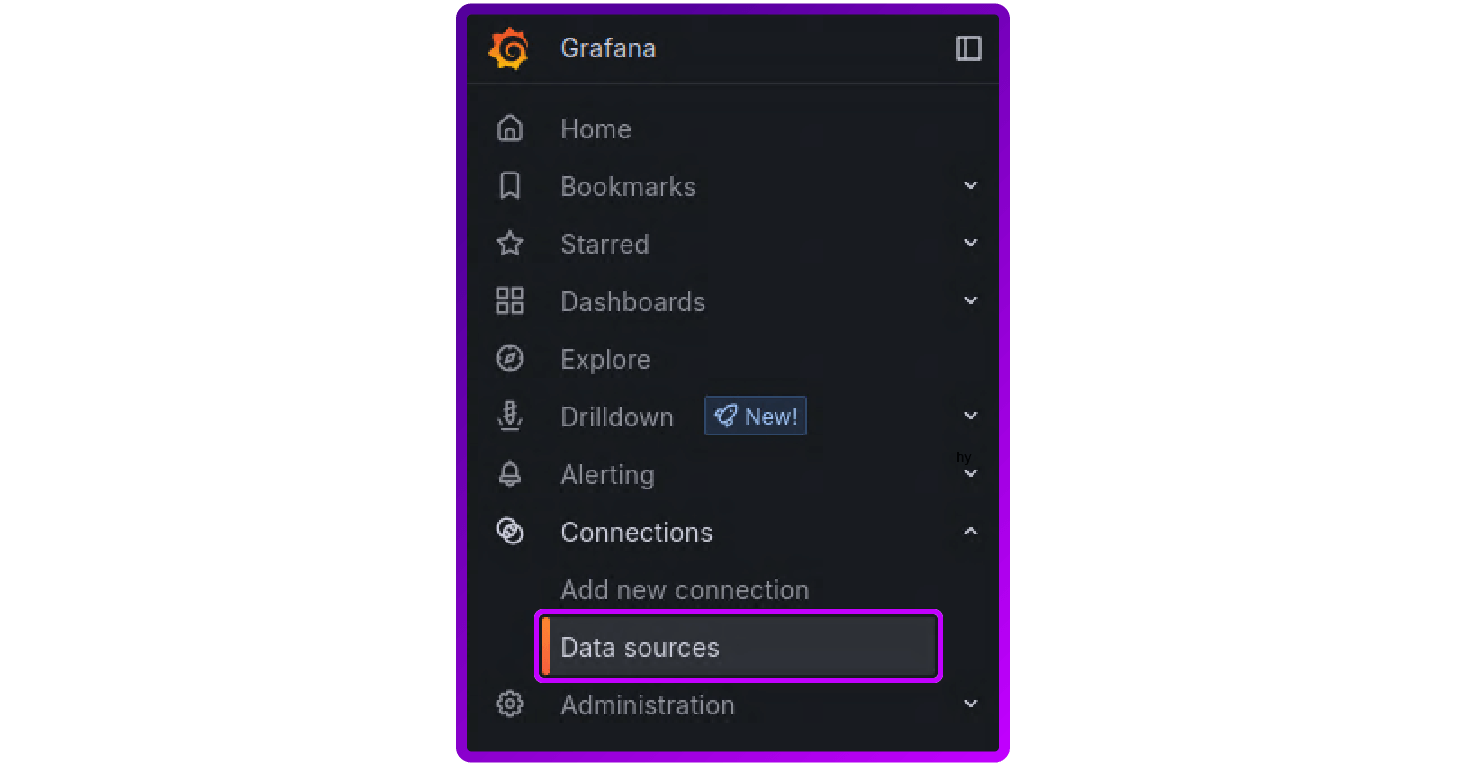
2. In the side menu expand Connections and click on Add new connection:
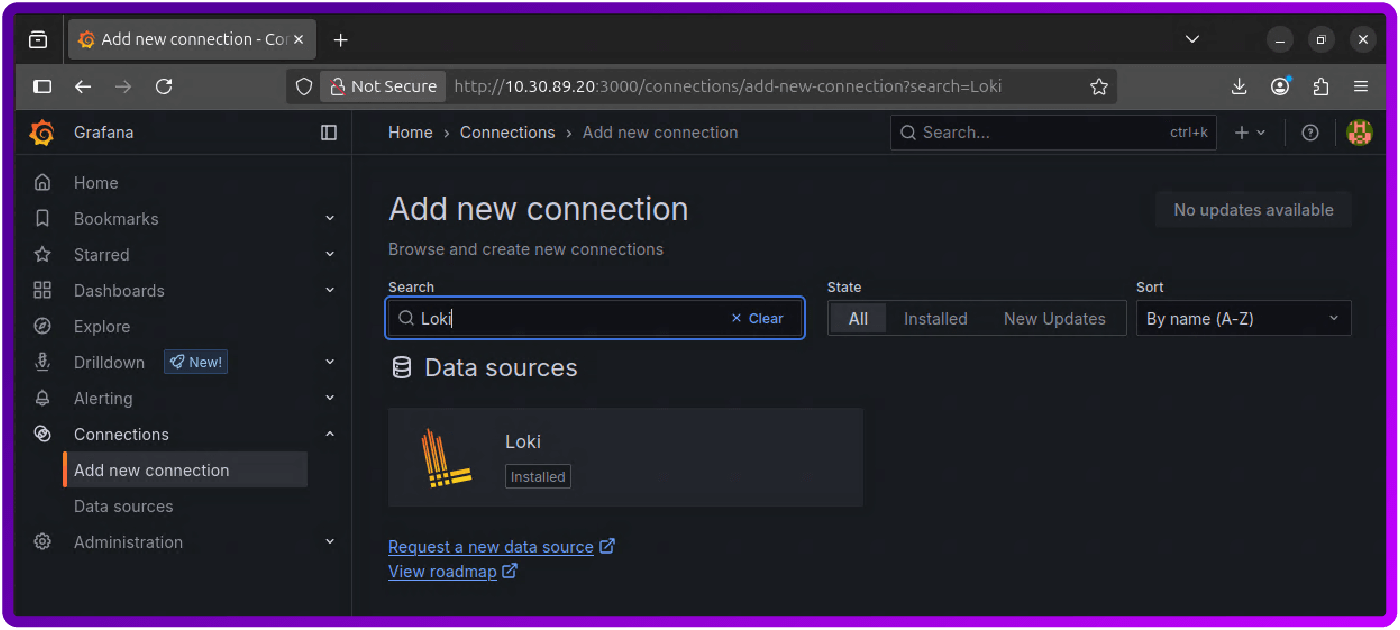
3. Search for Loki (it should say Installed; if not then click on it and then click the install button):
4. In the side menu, under Connections, click on Data source:
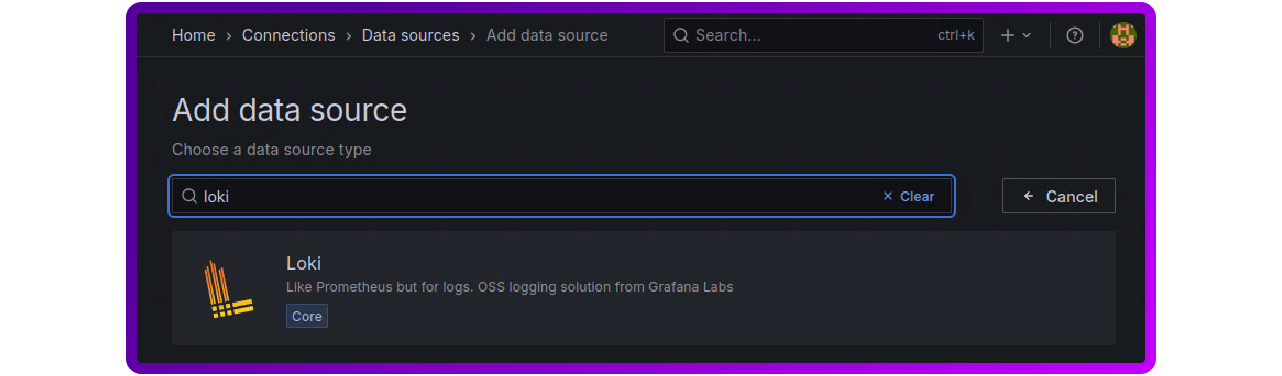
5. Click Add new data source button in the top right corner:

6. Search for Loki and click on it in the search results
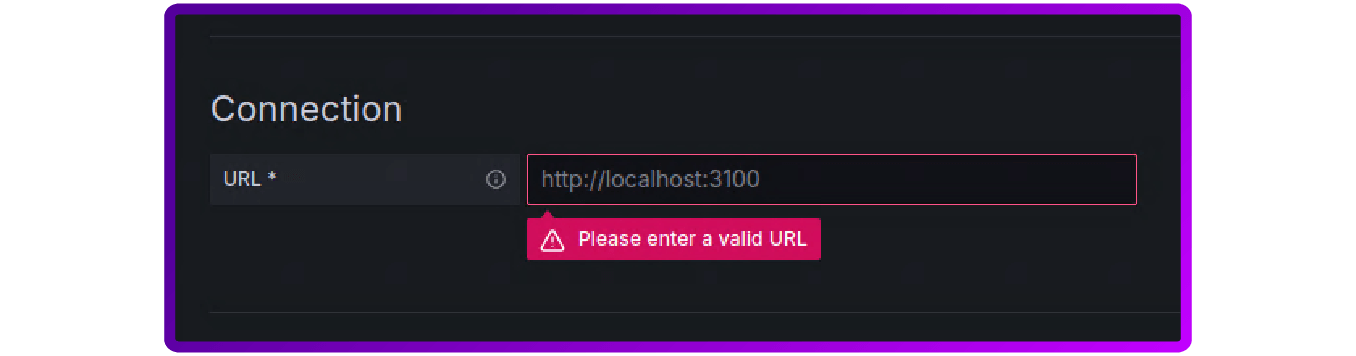
7. Under Connection add the Loki server address, remembering to add the protocol and port:
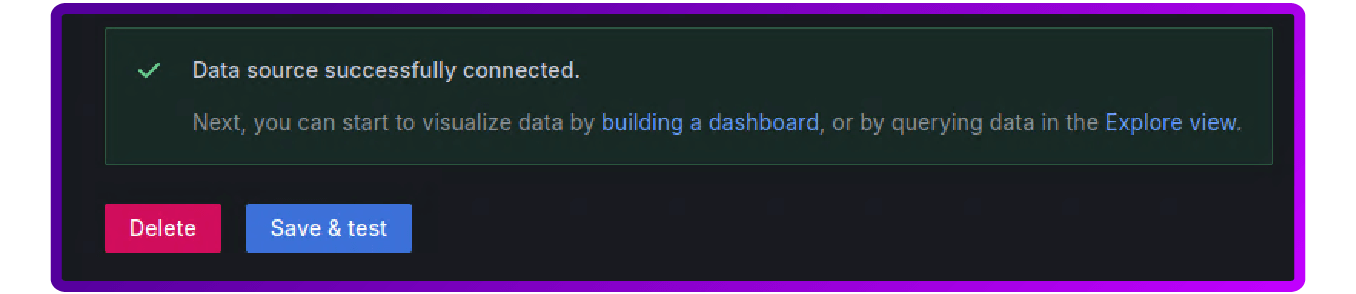
8. Scroll to the bottom and click Save & test, if everything works you should get a green message:
9. In the side menu if you now navigate to Drilldown and then logs, you should see Loki.source.syslog:
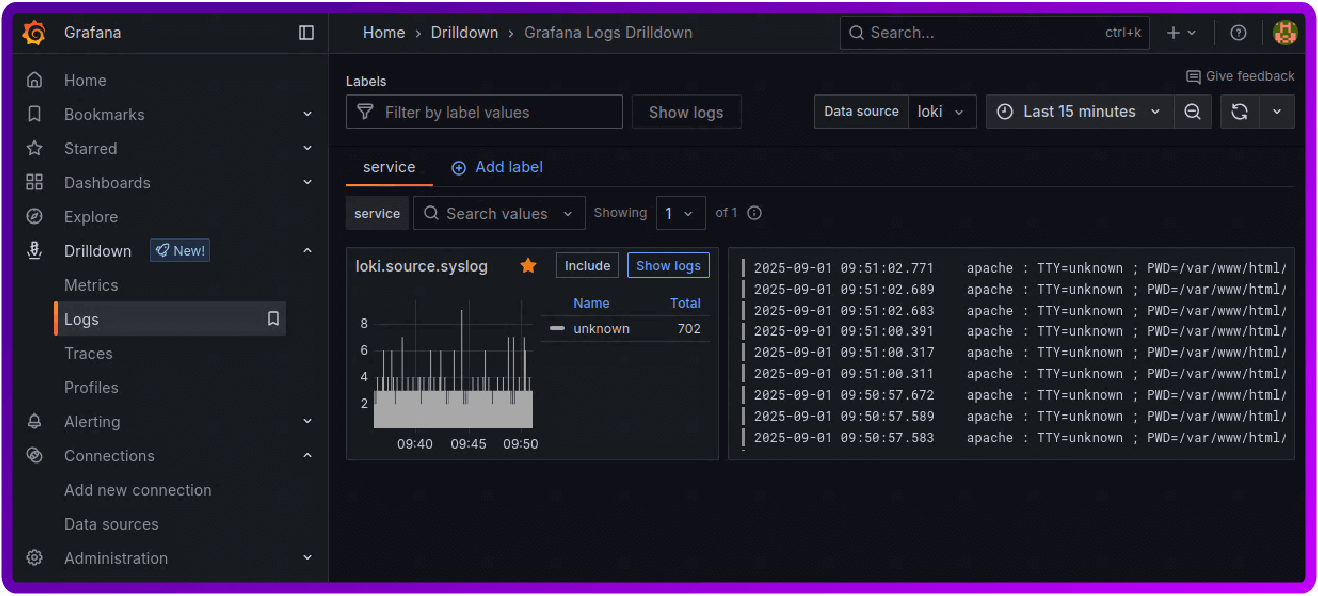
You should now be able to browse your data from HAProxy and write queries to extract an event of interest. This can then be used to create dashboard and configure Grafana Alert manager.
How to do all this with a Loadbalancer appliance
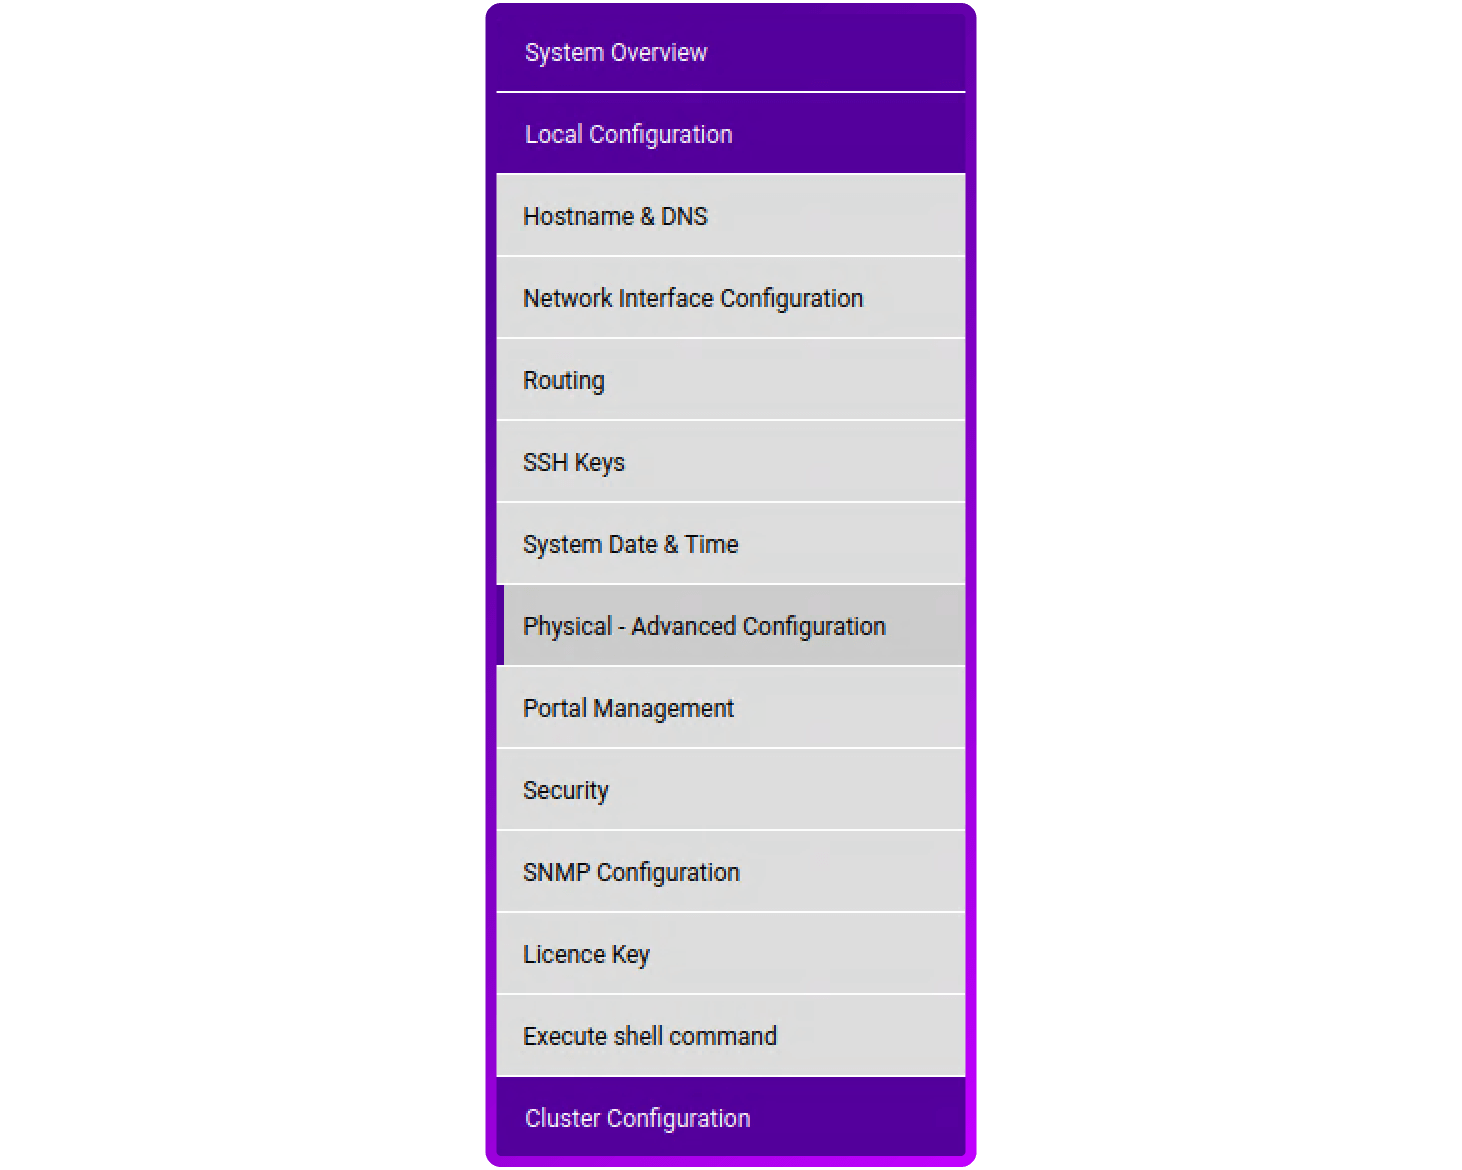
- Login to your load balancer, click on Local Configuration and then Physical - Advanced Configuration:
2. Scroll down to the logging configuration section:
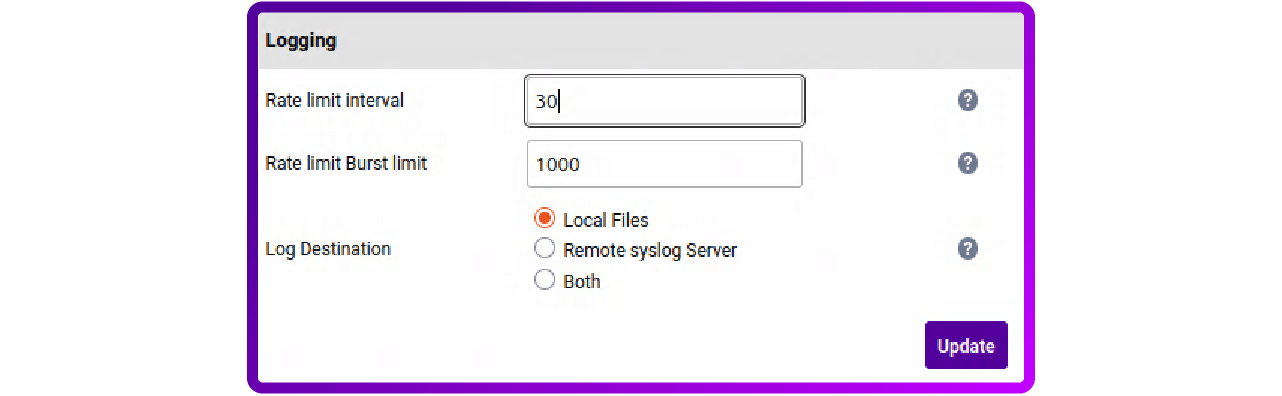
3. Select Remote syslog Server or Both (note, if you select Remote syslog Server, then all logs will be sent to your syslog server and the load balancer will stop logging locally (***Be aware, when a TSD is requested it will be emptier and cause delays in support!***):
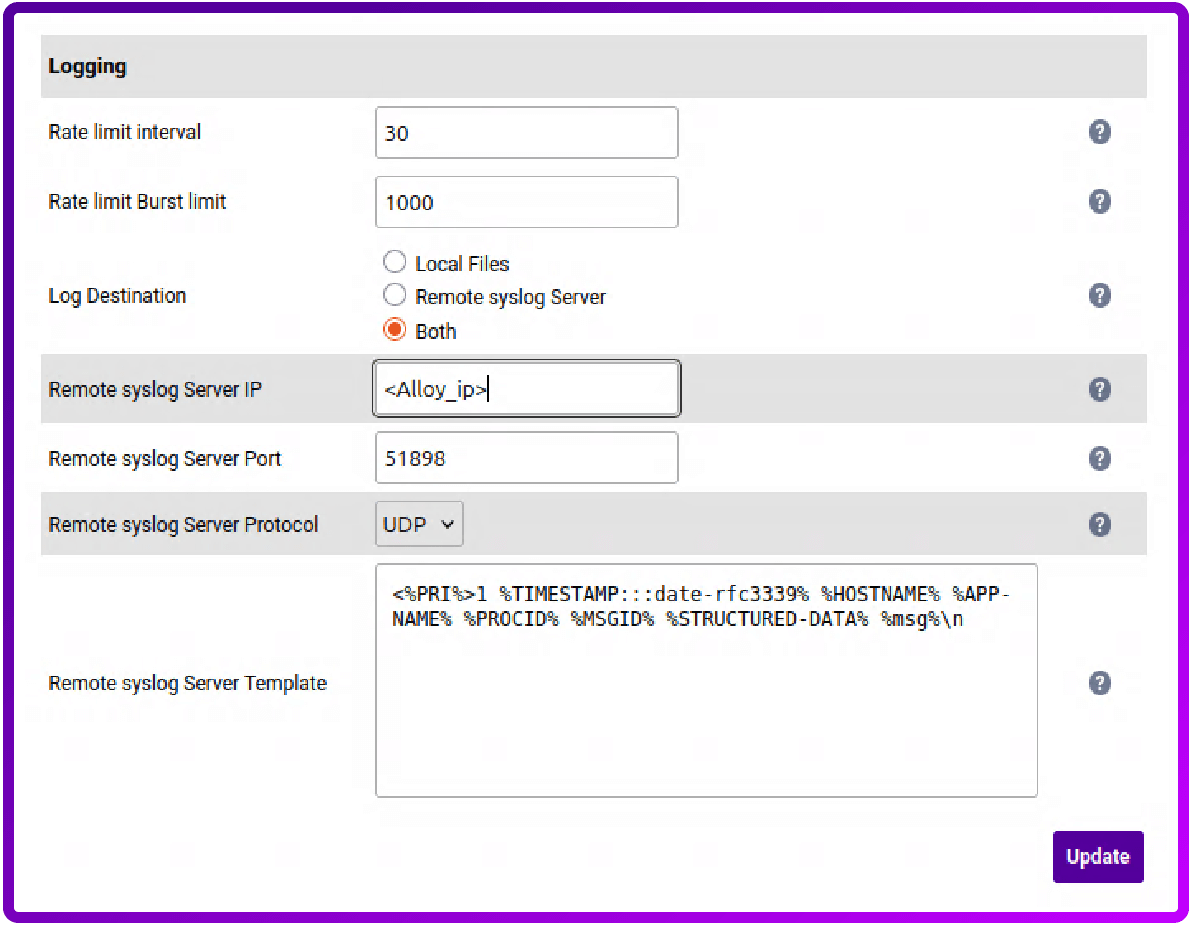
4. Set the IP address to the IP of the Alloy server, set the port to 51898 and leave the protocol set to UDP:
5. Place the following in the Remote syslog Server Template box:
<%PRI%>1 %TIMESTAMP:::date-rfc3339% %HOSTNAME% %APP-NAME% %PROCID% %MSGID% %STRUCTURED-DATA% %msg%\n- <%PRI%>1 = The priority of the syslog message set by the sending application
- %TIMESTAMP:::date-rfc3339% = The time and date stamp formated to the RFC3339 standard
- %HOSTNAME% = The sending systems host name, in are case the loadbalancer
- %APP-NAME% = The application on the loadbalancer creating the entery
- %PROCID% = The Process ID of the sending application on the loadbalancer
- %MSGID% = The Message Identifier, a field within the message header that provides a specific, identifying tag for the type of message being logged.
- %STRUCTURED-DATA% = A message component that provides structured, interpretable, and decomposable data elements
- %msg%\n = Contains the actual content of the log message, including the event details
6. Click Update
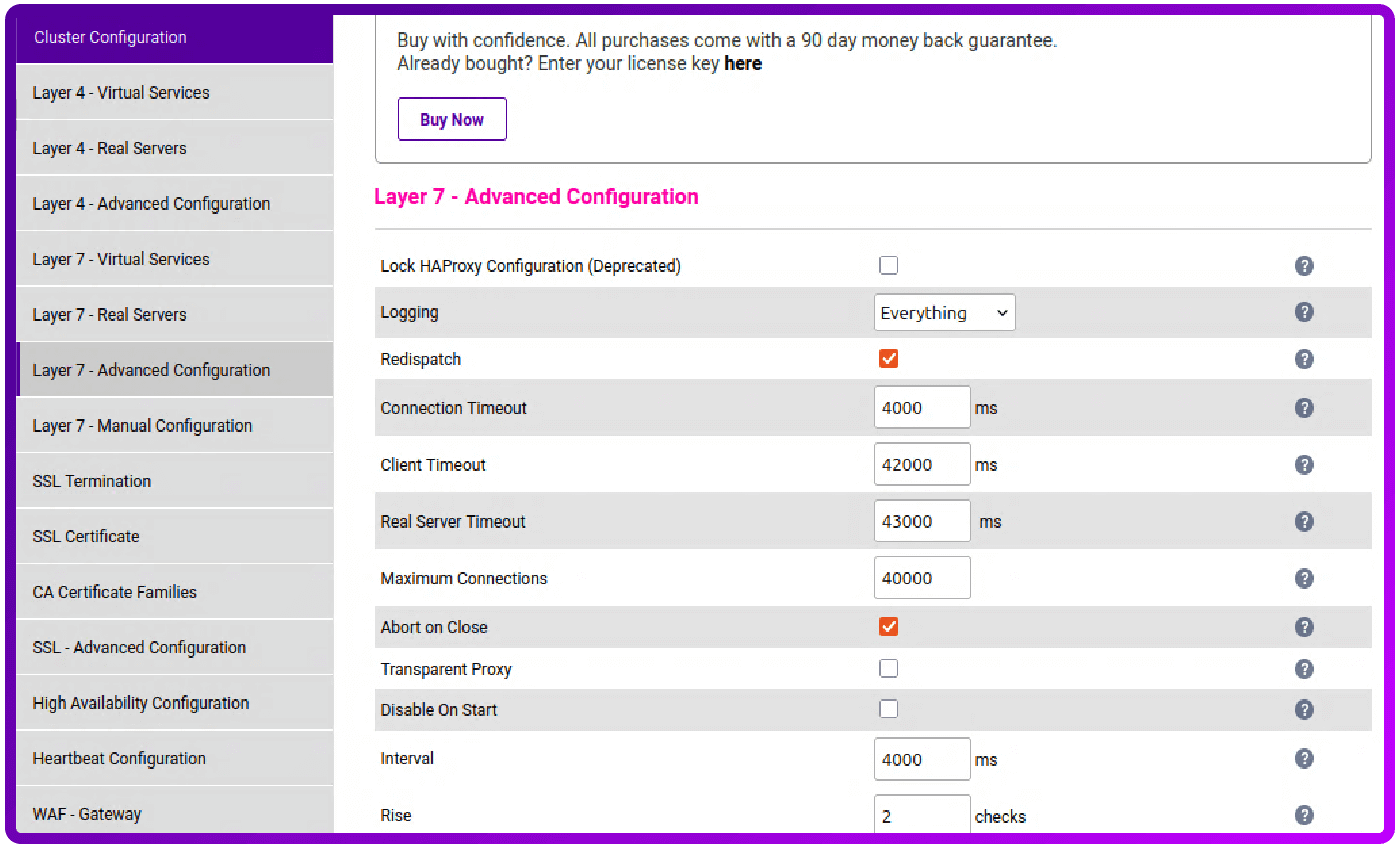
7. If you want to see HAProxy logs in Grafana then go to Cluster Configuration, Layer7 - Advanced Configuration and set the appropriate Logging level. After clicking Update make sure to restart HAProxy:
At this point you have configured remote sysloging for your Loadbalancer.org appliance! Remember, if you're running an HA pair make sure to repeat steps 1 - 7 on the secondary appliance.
Bonus resource: HAProxy log structure
If you get stuck at any point, the below table might be helpful when trying to troubleshoot:

These logs provide detailed information about each request and response, which is essential for maintaining a healthy and secure system.
Conclusion
By leveraging the power of Grafana, Loki, and Alloy, you can build a powerful, cost-effective, and scalable log aggregation system that centralizes your data for enhanced visibility and operational efficiency.
This integrated approach allows you to quickly troubleshoot issues, monitor system health, and gain deeper insights into your network traffic, ultimately saving your time and resources.