

Prometheus is an open-source system monitoring and alerting solution that collects and stores its metrics as time series data. With our recent release of the Loadbalancer.org appliance, you can now use the new Prometheus exporter to export the HAProxy metrics into an existing Prometheus environment. Here's how...
Turn on the Prometheus exporter on the Loadbalancer.org appliance
A new feature that is now available in version 8.7 of our loadbalancer.org appliance, is the support of the Prometheus metrics exporter for HAProxy. This can now be turned on directly from within the loadbalancer Web UI.
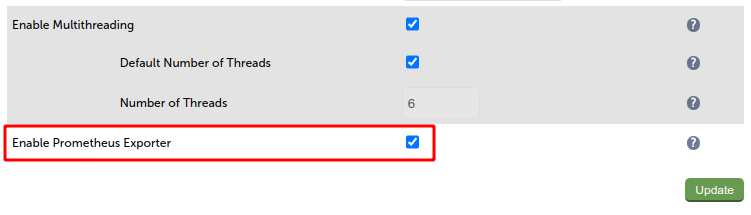
After signing into the web UI, navigate to Cluster Configuration, Layer 7 - Advanced Configuration. Scroll down to the bottom of this page, where you will find the option, Enable Prometheus Exporter. To enable this, ensure the checkbox is checked, then click on Update to apply the change.
To confirm that that exporter is working, open up a new browser tab, and enter the following URL (assuming your appliance IP address is 192.168.86.50):
https://192.168.86.50:9443/lbadmin/stats/l7prometheus/This should return a web page containing the HAProxy exported metrics. For example:
# HELP haproxy_process_build_info HAProxy build info.
# TYPE haproxy_process_build_info gauge
haproxy_process_build_info{version="2.0.28"} 1
# HELP haproxy_process_nbthread Configured number of threads.
# TYPE haproxy_process_nbthread gauge
haproxy_process_nbthread 2
# HELP haproxy_process_nbproc Configured number of processes.
# TYPE haproxy_process_nbproc gauge
haproxy_process_nbproc 1
# HELP haproxy_process_relative_process_id Relative process id, starting at 1.
# TYPE haproxy_process_relative_process_id gauge
haproxy_process_relative_process_id 1
# HELP haproxy_process_start_time_seconds Start time in seconds.
# TYPE haproxy_process_start_time_seconds gauge
haproxy_process_start_time_seconds 1662372636
# HELP haproxy_process_max_memory_bytes Per-process memory limit (in bytes); 0=unset.
# TYPE haproxy_process_max_memory_bytes gauge
haproxy_process_max_memory_bytes 0
# HELP haproxy_process_pool_allocated_bytes Total amount of memory allocated in pools (in bytes).
# TYPE haproxy_process_pool_allocated_bytes gauge
haproxy_process_pool_allocated_bytes 230432
# HELP haproxy_process_pool_used_bytes Total amount of memory used in pools (in bytes).
# TYPE haproxy_process_pool_used_bytes gauge
haproxy_process_pool_used_bytes 197664
# HELP haproxy_process_pool_failures_total Total number of failed pool allocations.
# TYPE haproxy_process_pool_failures_total counter
haproxy_process_pool_failures_total 0
# HELP haproxy_process_max_fds Maximum number of open file descriptors; 0=unset.
# TYPE haproxy_process_max_fds gauge
haproxy_process_max_fds 80046
# HELP haproxy_process_max_sockets Maximum numer of open sockets.
# TYPE haproxy_process_max_sockets gauge
haproxy_process_max_sockets 80046
# HELP haproxy_process_max_connections Maximum number of concurrent connections.
# TYPE haproxy_process_max_connections gauge
haproxy_process_max_connections 40000
# HELP haproxy_process_hard_max_connections Initial Maximum number of concurrent connections.
# TYPE haproxy_process_hard_max_connections gauge
haproxy_process_hard_max_connections 40000
# HELP haproxy_process_current_connections Number of active sessions.
# TYPE haproxy_process_current_connections gauge
haproxy_process_current_connections 1
# HELP haproxy_process_connections_total Total number of created sessions.
# TYPE haproxy_process_connections_total counter
haproxy_process_connections_total 9
Prometheus Configuration
Now that we have enabled the Prometheus exporter on our loadbalancer.org appliance, we now need to configure our Prometheus server to start collecting the metrics from it.
NOTE: The installation and configuration of the Prometheus server is outside the scope of this article, however, please refer to the Prometheus website, "first steps", on how to get it up and running.
YAML Configuration File
Prometheus stores all of its configuration within a YAML text file, that is usually found in /etc/prometheus/prometheus.yml on the system where the Prometheus server is installed.
To add the loadbalancer.org appliance to your Prometheus server, open the prometheus.yml file using your favourite file editor, for example nano.
sudo nano /etc/prometheus/prometheus.ymlAdd the following to the end of the configuration file, under the section, scrape_configs (remember to change the IP address in the example below to your own appliance IP address):
#
# Loadbalancer.org 8.70 Prometheus Exporter Metrics
#
  - job_name: "lb 8.70 prometheus exporter"
    scrape_interval: 30s
    scrape_timeout: 30s
    metrics_path: "/lbadmin/stats/l7prometheus/"
    scheme: "https"
    basic_auth:
      username: "loadbalancer"
      password: "loadbalancer"
    tls_config:
      insecure_skip_verify: true
    static_configs:
      - targets: ["192.168.86.50:9443"]
... so the complete config file should look similar to the following:
# my global config
global:
  scrape_interval: 15s # Set the scrape interval to every 15 seconds. Default is every 1 minute.
  evaluation_interval: 15s # Evaluate rules every 15 seconds. The default is every 1 minute.
  # scrape_timeout is set to the global default (10s).

# Alertmanager configuration
alerting:
  alertmanagers:
    - static_configs:
        - targets:
          # - alertmanager:9093

# Load rules once and periodically evaluate them according to the global 'evaluation_interval'.
rule_files:
  # - "first_rules.yml"
  # - "second_rules.yml"

# A scrape configuration containing exactly one endpoint to scrape:
# Here it's Prometheus itself.
scrape_configs:

#
# Loadbalancer.org 8.70 Prometheus Exporter Metrics
#
  - job_name: "lb 8.70 prometheus exporter"
    scrape_interval: 30s
    scrape_timeout: 30s
    metrics_path: "/lbadmin/stats/l7prometheus/"
    scheme: "https"
    basic_auth:
      username: "loadbalancer"
      password: "loadbalancer"
    tls_config:
      insecure_skip_verify: true
    static_configs:
      - targets: ["192.168.86.50:9443"]
NOTE: Watch out for indentations, as the file validation may complain if the indentations are incorrect.
It's also worth noting that the configuration of a loadbalancer.org appliance for Prometheus requires a little more than a standard collection. Below is an explanation of the requirements for this to work.
| Key | value |
|---|---|
| job_name | This label is used to identify the name of the collection and should be in double quotes. |
| scrape_interval | How often the collection from the target should occur. Every 30 seconds should be enough. |
| scrape_timeout | If the exporter goes off-line, then how long should the collection wait before giving up. 30 seconds is the default. |
| metric_path | For the Loadbalancer.org appliance, this should be /lbadmin/stats/l7prometheus/ |
| scheme | This should be set to https for the Loadbalancer.org appliance. |
| basic_auth | There are two parts to this, username and password. The credentials here are those used to log into the appliance. |
| tls_config | Because the Loadbalancer.org appliance uses a self-signed certificate, it's important to set insercure_skip_verify to true. |
| static_configs | Here the targets for metrics scraping are defined. For a Loadbalancer.org appliance, the ip address and the port, 9443 are defined. This can be a list of hosts, delimited by a comma. |
Verify the Prometheus configuration
Before re-starting the Prometheus server with the updated configuration, It's important to verify that the file formatting and indentation are correct, otherwise any discrepancies will cause the server instance to fail. Fortunately, Prometheus has a tool to check this, called promtool. Just run the following command to verify that the configuration file is valid:
promtool check config /etc/prometheus/prometheus.ymlFor example:
#promtool check config /etc/prometheus/prometheus.yml
Checking /etc/prometheus/prometheus.yml
 SUCCESS: /etc/prometheus/prometheus.yml is valid prometheus config file syntax

#
If everything is OK, you should see a SUCCESS result after executing the promtool command.
Providing the promtool passed the updates, we can now restart the Prometheus server to load the newly added loadbalancer.org appliance to its collection stack.
sudo systemctl restart prometheusTo check that the service restarted successfully, we can check its status, by issuing the following:
sudo systemctl status prometheusWhich should produce an output similar to the example below:
● prometheus.service - Prometheus
     Loaded: loaded (/etc/systemd/system/prometheus.service; enabled; vendor preset: enabled)
     Active: active (running) since Wed 2022-07-20 12:24:34 BST; 30s ago
       Docs: https://prometheus.io/docs/introduction/overview/
   Main PID: 2942767 (prometheus)
      Tasks: 11 (limit: 18885)
     Memory: 54.6M
     CGroup: /system.slice/prometheus.service
             └─2942767 /usr/local/bin/prometheus --config.file=/etc/prometheus/prometheus.yml
Prometheus Service Discovery
All going well, we should now be able to see the newly added collection under the Service Discovery page, via the Prometheus web UI. This is normally running on port 9090 by default. For example, the following URL, with the Prometheus server running on the ip address, 192.168.85.0 will show the list of discovered services.
http://192.168.85.0:9090/service-discovery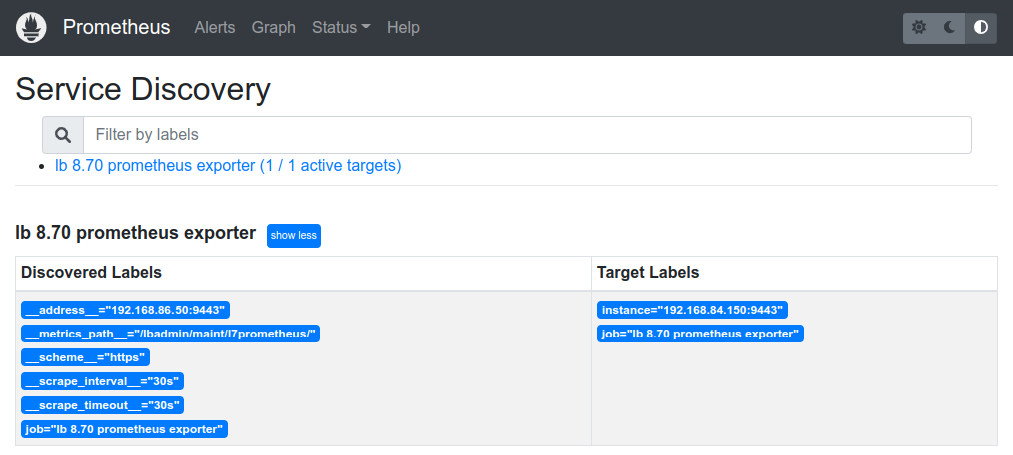
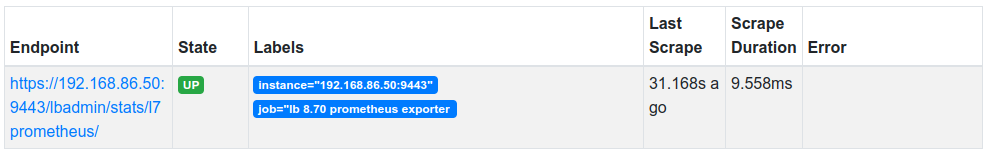
From the Status menu, selecting Targets will also show the State and Last Scrape time plus any errors or issues (if encountered) with the collection target. All going well this should resemble something like the example below:
Conclusion
Now that the HAProxy metrics are now being collected by Prometheus, graphing tools such as Grafana can be used relatively easily to graph the exported data. Watch this space for the next installment on how to use Grafana to visualize the Loadbalancer.org appliance data.